(301) 657-9883 info@econometricainc.com

Report Calls for National Eviction Database to Better Track Trends

House CutoutPolicymakers need reliable data to develop tools and strategies to effectively combat the nation’s eviction epidemic, according to a report exploring the prevalence and impact of evictions.

The report, which appeared in Evidence Matters in summer 2021, found that current eviction data are often incomplete, incorrect, or difficult to compare across geographic areas. Thus, the authors call for the development of a national eviction database.

“Building a national eviction database that aggregates standardized and reliable local data will significantly improve researchers’ ability to understand trends in eviction rates across time and space,” wrote Dana Goplerud and Craig Pollack, both of Johns Hopkins University.

The aim of the database would be to improve the ability to track and understand eviction trends, allowing policymakers to design more effective policies and tools to prevent eviction.

The authors recognize that many evictions happen outside of the court system; thus, they also explain how surveys at the national and local levels would capture information from renters about their experiences.

Work With Us, Work for Us

Econometrica specializes in research and management across numerous industries in both the public and private sectors. We are always looking to hire the best and brightest in data science, health, grants management, energy, homeland security, housing and community development, capital markets and finance, and transportation. We work as the lead service provider, and also as a capable outsource partner to other consultancies. To work with us on your next project, visit us online and email a member of our executive staff in your preferred specialty. To explore the benefits of working for us, visit our careers page.

Census Releases Redistricting Data in Additional Format

The U.S. Census Bureau recently released its 2020 census redistricting data in an easier-to-use format. Data users will be able to access data with demographic information for cities and towns without downloading the FTP files.

Data.census.gov allows users to search geographies down to the block level and access data through tables, maps, and downloads.

For more information, visit https://www.census.gov/newsroom/press-releases/2021/2020-census-redistricting-data-easier-to-use-format.html

CMS Releases Updated Look at COVID-19’s Impact on the Medicare Population

The Centers for Medicare & Medicaid Services (CMS) recently released a snapshot of the impact COVID-19 has had on the Medicare population. The monthly update, released June 30, shows there were more than 4.3 million COVID-19 cases among the Medicare population and more than 1.2 million COVID-19 hospitalizations.

Data in the snapshot covers the period January 1, 2020, to April 24, 2021.

A factsheet and additional information can be fund at:

Work With Us, Work for Us

Econometrica specializes in research and management across numerous industries in both the public and private sectors. We are always looking to hire the best and brightest in data science, health, grants management, energy, homeland security, housing and community development, capital markets and finance, and transportation. We work as the lead service provider, and also as a capable outsource partner to other consultancies. To work with us on your next project, visit us online and email a member of our executive staff in your preferred specialty. To explore the benefits of working for us, visit our careers page.
Census Releases Demonstration Data and Progress Metrics for New DAS

The Census Bureau continues to roll out data and information from the 2020 census. On April 28, it provided information about a new cryptography-inspired disclosure avoidance system (DAS) to protect the privacy of respondents. Using data from the 2010 census for demonstration purposes, Census has released several files of data to solicit feedback from users. The bureau hopes users can provide detailed information on the files’ fitness-for use, privacy, and any improvements that should be made.

More information can be found at:

Using data from the 2010 census for demonstration purposes, Census has released several files of data to solicit feedback from users.

Census Announces Results of 2020 Census, Population Counts for Apportionment

Census Announces Results of 2020 Census, Population Counts for Apportionment

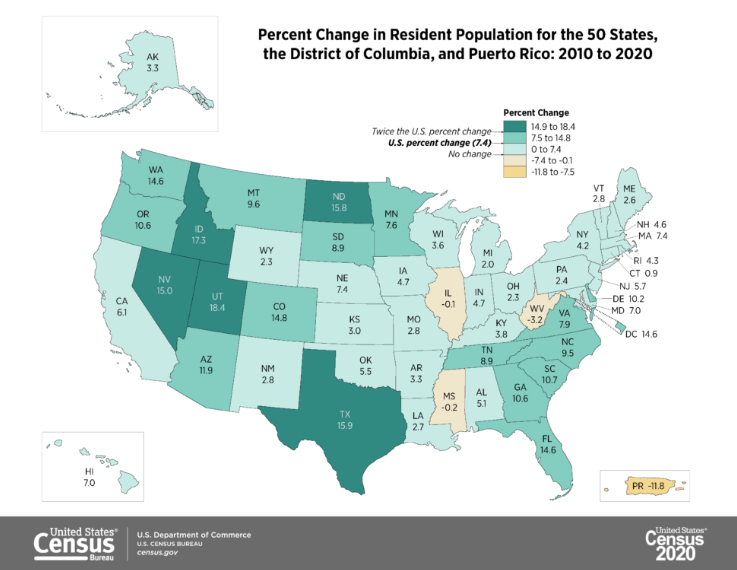
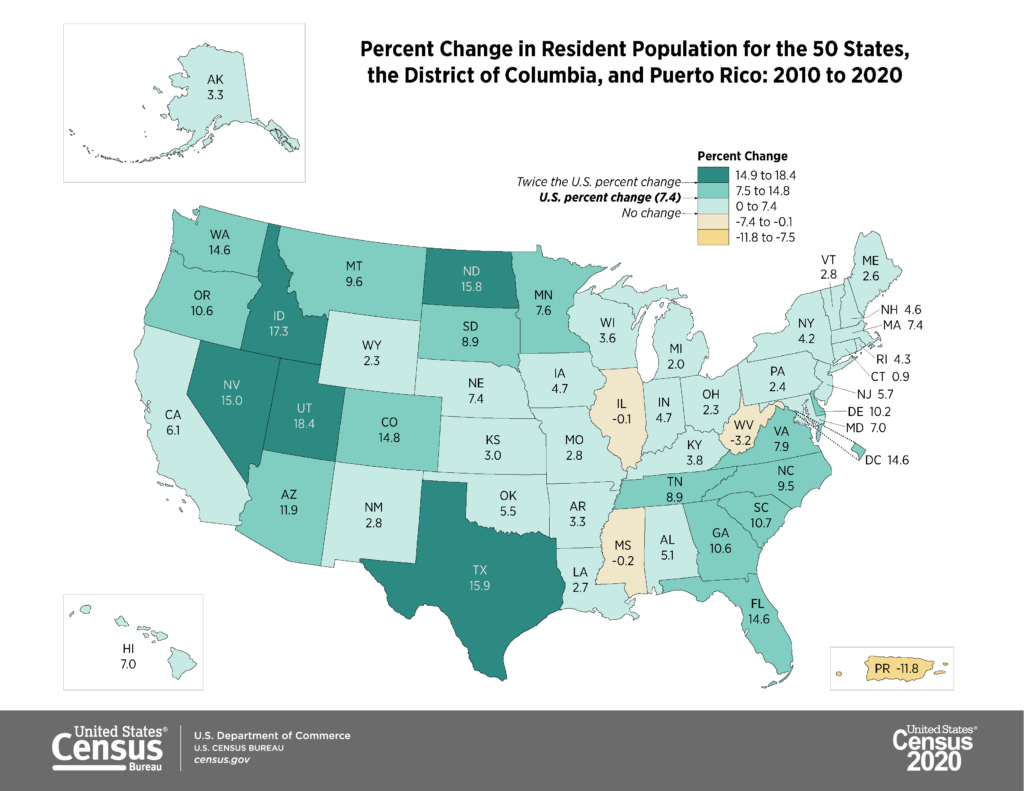
The U.S. Census announced on April 26 that the 2020 census shows the population of the United States is 331,449,281. This represents growth of 7.4 percent from the 2010 census. This also represents the second slowest population growth rate in U.S. history.

“The American public deserves a big thank you for its overwhelming response to the 2020 Census,” Secretary of Commerce Gina Raimondo said in a statement. “Despite many challenges, our nation completed a census for the 24th time. This act is fundamental to our democracy and a declaration of our growth and resilience. I also want to thank the team at the U.S. Census Bureau, who overcame unprecedented challenges to collect and produce high-quality data that will inform decision-making for years to come.”

The population grew the fastest over the last decade in the South (10.2 percent) and in the West (9.2 percent). The Northeast and Midwest saw slower growth (4.1 percent and 3.1 percent, respectively). On average, each member of the House will represent 761,169 residents.

Map showing the percent change in resident population for the 50 states, the District of Columbia, and Puerto Rico, from 2010 to 2020

Map showing the percent change in resident population for the 50 States, the District of Columbia, and Puerto Rico, from 2010 to 2020. Source: U.S. Census Bureau, https://www2.census.gov/programs-surveys/decennial/2020/data/apportionment/apportionment-2020-map03.png.

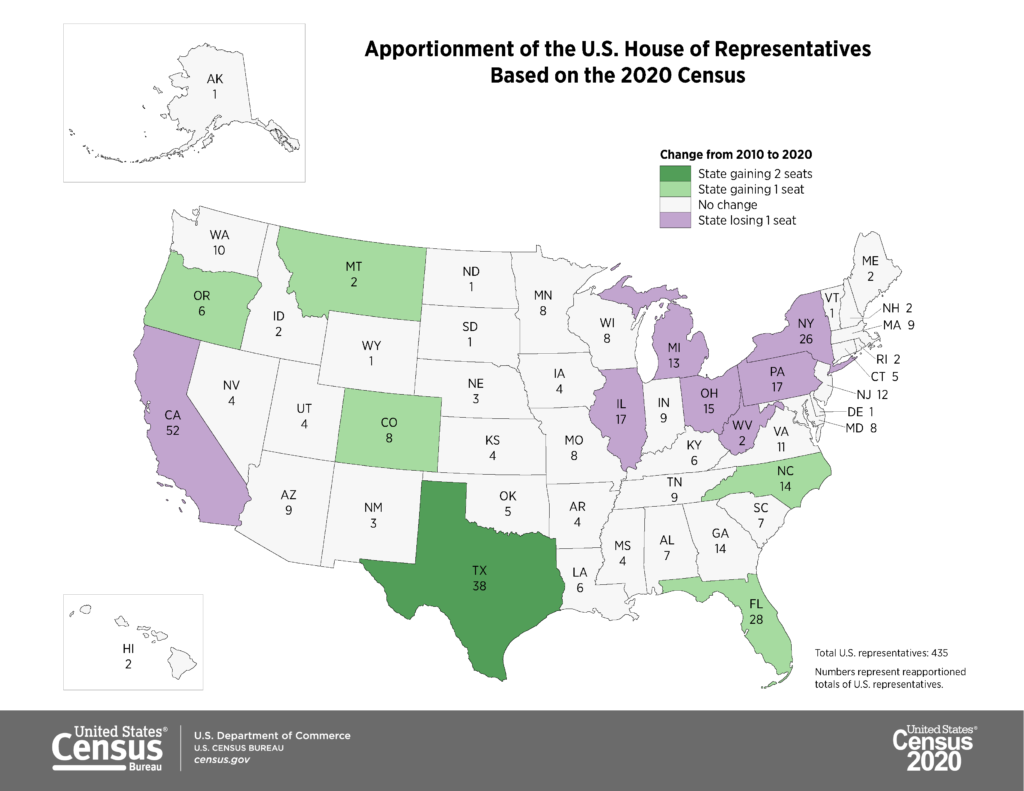
The data release also included the State population counts used to apportion the seats in the U.S. House of Representatives. The 2022 election will be the first to use this new data. In total, seven seats will shift:

  • Six States will gain House seats; Texas gained two seats, while Colorado, Florida, Montana, North Carolina, and Oregon each gained one seat.
  • Seven states—California, Illinois, Michigan, New York, Ohio, Pennsylvania, and West Virginia—each will lose one seat.

Apportionment, which takes place every 10 years, is the process of distributing the 435 seats in the House among the 50 States. The results of the 2020 census are used to draw congressional and State legislative districts. The apportionment population excludes the population of the District of Columbia and Puerto Rico, which do not have voting members in the House.

Map showing apportionment of the U.S. House of Representatives Based on the 2020 Census

Map showing apportionment of the U.S. House of Representatives based on the 2020 census. Source: U.S. Census Bureau, https://www2.census.gov/programs-surveys/decennial/2020/data/apportionment/apportionment-2020-map01.png.

Local to Econometrica:

  • Maryland’s population was 6,177,224, up from 5,773,552 in 2010.
  • Virginia’s population rose to 8,631,393 from 8,001,024 in 2010.
  • The District of Columbia was 689,545, up from 601,723 in 2010.

For more information about the 2020 census data and apportionment, visit the Census Bureau’s 2020 Census Apportionment Results press kit.

Related Links:

The population grew the fastest over the last decade in the South (10.2 percent) and in the West (9.2 percent). The Northeast and Midwest saw slower growth (4.1 percent and 3.1 percent, respectively).