(301) 657-9883 info@econometricainc.com
Census Announces Results of 2020 Census, Population Counts for Apportionment

Census Announces Results of 2020 Census, Population Counts for Apportionment

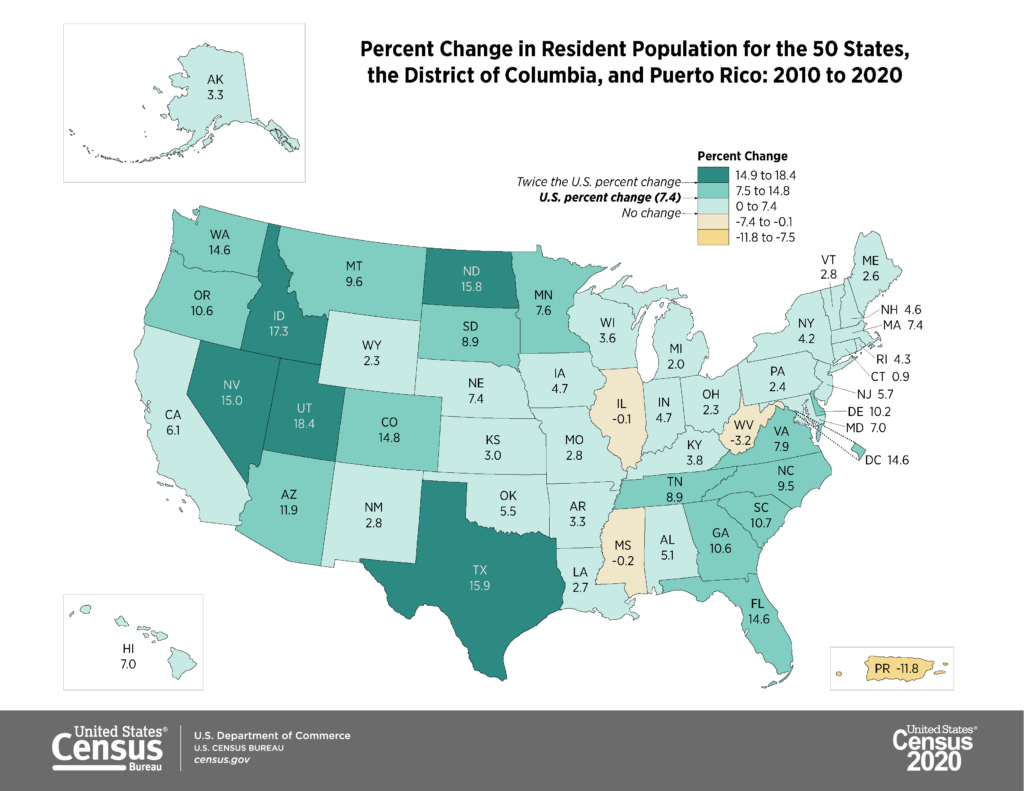
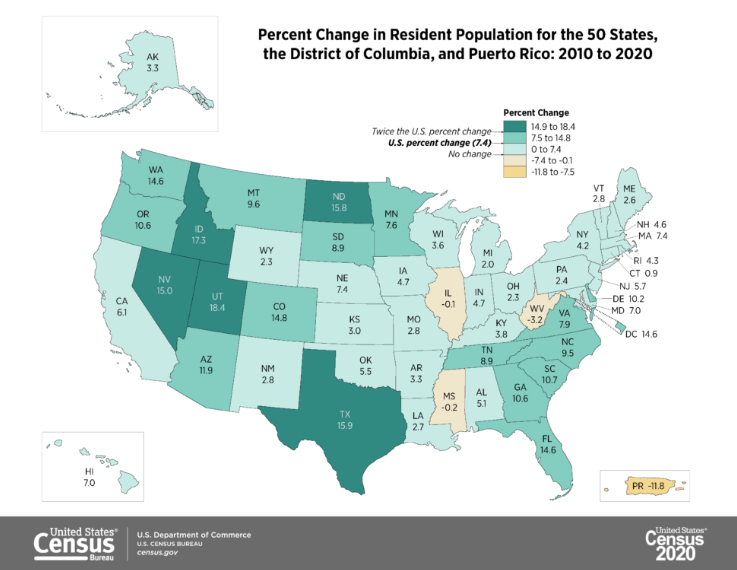
The U.S. Census announced on April 26 that the 2020 census shows the population of the United States is 331,449,281. This represents growth of 7.4 percent from the 2010 census. This also represents the second slowest population growth rate in U.S. history.

“The American public deserves a big thank you for its overwhelming response to the 2020 Census,” Secretary of Commerce Gina Raimondo said in a statement. “Despite many challenges, our nation completed a census for the 24th time. This act is fundamental to our democracy and a declaration of our growth and resilience. I also want to thank the team at the U.S. Census Bureau, who overcame unprecedented challenges to collect and produce high-quality data that will inform decision-making for years to come.”

The population grew the fastest over the last decade in the South (10.2 percent) and in the West (9.2 percent). The Northeast and Midwest saw slower growth (4.1 percent and 3.1 percent, respectively). On average, each member of the House will represent 761,169 residents.

Map showing the percent change in resident population for the 50 states, the District of Columbia, and Puerto Rico, from 2010 to 2020

Map showing the percent change in resident population for the 50 States, the District of Columbia, and Puerto Rico, from 2010 to 2020. Source: U.S. Census Bureau, https://www2.census.gov/programs-surveys/decennial/2020/data/apportionment/apportionment-2020-map03.png.

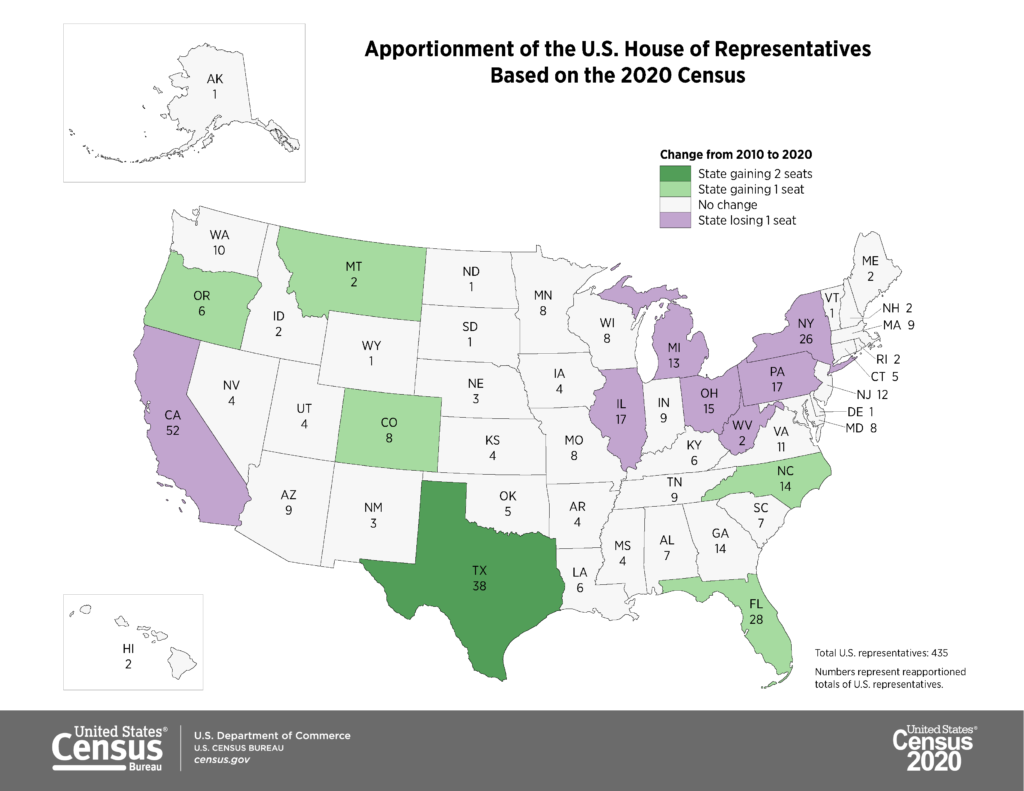
The data release also included the State population counts used to apportion the seats in the U.S. House of Representatives. The 2022 election will be the first to use this new data. In total, seven seats will shift:

  • Six States will gain House seats; Texas gained two seats, while Colorado, Florida, Montana, North Carolina, and Oregon each gained one seat.
  • Seven states—California, Illinois, Michigan, New York, Ohio, Pennsylvania, and West Virginia—each will lose one seat.

Apportionment, which takes place every 10 years, is the process of distributing the 435 seats in the House among the 50 States. The results of the 2020 census are used to draw congressional and State legislative districts. The apportionment population excludes the population of the District of Columbia and Puerto Rico, which do not have voting members in the House.

Map showing apportionment of the U.S. House of Representatives Based on the 2020 Census

Map showing apportionment of the U.S. House of Representatives based on the 2020 census. Source: U.S. Census Bureau, https://www2.census.gov/programs-surveys/decennial/2020/data/apportionment/apportionment-2020-map01.png.

Local to Econometrica:

  • Maryland’s population was 6,177,224, up from 5,773,552 in 2010.
  • Virginia’s population rose to 8,631,393 from 8,001,024 in 2010.
  • The District of Columbia was 689,545, up from 601,723 in 2010.

For more information about the 2020 census data and apportionment, visit the Census Bureau’s 2020 Census Apportionment Results press kit.

Related Links:

The population grew the fastest over the last decade in the South (10.2 percent) and in the West (9.2 percent). The Northeast and Midwest saw slower growth (4.1 percent and 3.1 percent, respectively).

Econometrica’s Statement Following Conviction of Derek Chauvin

Econometrica’s Statement Following Conviction of Derek Chauvin

GeorgeFloydBETHESDA, MD – The past year has been difficult for many reasons, not least because the Nation has witnessed many traumatizing instances of police brutality against Black Americans. The trial and conviction of Derek Chauvin for the murder of George Floyd is but a small step toward bringing accountability to and eliminating systemic racism from our justice system. The trial may be over, but the conversation about structural racism and inequity must not end here.

Econometrica continues, and will always, actively stand with the Black community, our colleagues, their families, and clients in the fight against racism, injustice, and inequality. We will continue to strive to create and maintain a diverse and welcoming workplace, something that is pivotal to our high-quality work, mission, and success. Our colleagues deserve it, and our clients and partners expect it. We must not lose sight of these issues, today or in the future; we must instead work to make a positive impact on the world.

Econometrica continues, and will always, actively stand with the Black community, our colleagues, their families, and clients in the fight against racism, injustice, and inequality.

Suez Blockage Highlights Need for Transportation Network Vulnerability Tools

The recent blockage of the Suez Canal delayed worldwide shipping and caused billions in damages. A Bloomberg analysis reported that the grounding of the Ever Given held up as much as $9.6 billion in cargo per day, and The New York Times reported that it could take years to sort out all of the costs of the blockage.

The blockage highlights the need for transportation network vulnerability assessment tools, such as the port delay model developed by Econometrica to help the U.S. Coast Guard (USCG) evaluate the economic costs of port closures.

USCG regulations affect a wide range of nonmarket factors, including risks of fatal and nonfatal injuries, ecosystem damage due to oil and hazardous materials spills, and economic disruption associated with natural and manmade disasters. As part of a larger study to advance the methods USCG uses to estimate the benefits of its regulations, Econometrica developed two scenario-based simulation models to estimate the economic costs of maritime transportation delays:

  • Deep Water Port (DWP) model
  • Inland Waterway (IW) model

The DWP model addresses delays associated with ocean-borne freight, whereas the IW model addresses freight delays that occur as a result of disruptions on inland waterways. Both models allow USCG to posit a variety of scenarios involving both expected and unexpected port disruptions/closures.

The models incorporate queuing and rerouting algorithms that depend on the specified length of the delay for the scenario. The models can distinguish between short-term delays—where delayed cargo is not rerouted—and longer-term delays, in which cargo is rerouted to a different port to mitigate the increasing cost of waiting for the delay to clear. In this regard, the models provide costs associated with queuing (or waiting for the delay to clear) as well as rerouting, if applicable.

The main cost elements include:

  • Increased transportation costs (e.g., fuel and other operating expenses) that accrue during the delay as a result of increased transit time, rerouting, and/or use of alternative modes of inland transportation.
    • Marine vessels.
    • Inland transportation modes.
  • Costs to shippers resulting from the additional transit time, including depreciation and inventory carrying costs.
  • Environmental costs that ensue as a result of increased transportation distances associated with rerouting or the temporary use of alternative transportation modes that have higher pollution emission rates.
  • Public safety costs attributable to reduced safety due to increased transportation distances associated with rerouting or temporary use of alternative transportation modes that are less safe than the normal water transportation modes used.

To create a specific user-defined scenario, users must enter the following types of information:

  • The length of the delay incident.
  • The volume of freight delayed during the incident.
  • Whether the delay is caused by an expected or unexpected type of event.
  • The coast on which the delay incident occurs.
  • Whether a random port is affected or a specific port is affected.
  • Whether all commodities are affected or a specific commodity is affected.

The models use this information to compute how much cargo is rerouted and queued, the additional time and distance associated with queuing and rerouting, and how long it takes to clear the delayed cargo given the backlog generated during the incident. The DWP model uses a gravity-like algorithm in conjunction with the Federal Highway Administration’s Freight Analysis Framework database to reroute cargo from affected ports to alternate ports; the algorithm also computes several weighted-average metrics associated with rerouting, including marine distances, inland transportation distances, and inland transportation mode shifts. The IW model uses a tow arrival algorithm to capture rerouting decisions when there are closures on the Nation’s inland waterway system.

Based on these calculations, the models estimate the total economic costs attributable to the simulated port closure. The models also provide other capabilities, including the ability to compare delay costs for different commodity groups and the inclusion of a regulatory scenario analyzer that projects delay costs over a user-specified forecast horizon.

Work With Us, Work for Us

Econometrica, Inc., is a small business research and management consulting organization based in the greater Washington, DC, metropolitan area. We are committed to improving the human condition by providing high-quality, cost-effective analytics and support that enable our clients to solve the challenges of today’s world. We collaborate with Federal agencies, State and local governments, philanthropic and nonprofit clients, and private-sector partners in the public health, healthcare, data analytics, housing, and finance sectors.

To work with us on your next project, visit us online or email us at Info@EconometricaInc.com. To explore the benefits of working for us, visit our careers page. Follow us on LinkedIn, X, Facebook, and Instagram.

The blockage highlights the need for transportation network vulnerability assessment tools, such as the port delay model developed by Econometrica to help the U.S. Coast Guard (USCG) evaluate the economic costs of port closures.

Econometrica’s Continuing Support for HUD

Econometrica has provided technical assistance and training, policy and program analysis, statistical surveys and research, market and feasibility analysis, and knowledge management to HUD, housing authorities, and other organizations nationwide over the years. Since 2011, Econometrica has provided technical assistance through HUD’s OneCPD/Community Compass initiative, which has convened a community of technical assistance providers to serve the Office of Public and Indian Housing, Office of Community Planning and Development (CPD), and other HUD programs and customers. Through OneCPD/Community Compass, Econometrica has provided a variety of services, with a focus on housing, community development, economic development, and neighborhood stabilization.

Econometrica also has evaluated the Rental Assistance Demonstration program, examining the new opportunities RAD creates for public housing authorities to improve public housing physical conditions, how RAD helps PHAs preserve those units over the long term, and the impact of these changes on tenants.

Our staff and business associates comprise a diverse mix of personnel, including former government employees with decades of experience in housing and community development programs, academic researchers from distinguished universities, and highly skilled housing professionals with hands-on experience in housing management, finance, grants monitoring, and other types of support. We are dedicated to supporting our clients in their diverse missions to expand and improve affordable housing, promote homeownership opportunities, stimulate community transformation, assist with disaster recovery, comply with reporting requirements, and enhance their performance.

Work With Us, Work for Us

Econometrica, Inc., is a small business research and management consulting organization based in the greater Washington, DC, metropolitan area. We are committed to improving the human condition by providing high-quality, cost-effective analytics and support that enable our clients to solve the challenges of today’s world. We collaborate with Federal agencies, State and local governments, philanthropic and nonprofit clients, and private-sector partners in the public health, healthcare, data analytics, housing, and finance sectors.

To work with us on your next project, visit us online or email us at Info@EconometricaInc.com. To explore the benefits of working for us, visit our careers page. Follow us on LinkedIn, X, Facebook, and Instagram.

Econometrica also has evaluated the Rental Assistance Demonstration program, examining the new opportunities RAD creates for public housing authorities to improve public housing physical conditions, how RAD helps PHAs preserve those units over the long term, and the impact of these changes on tenants.

Econometrica Explores ESRD Treatments From the Patient Perspective

Econometrica Explores ESRD Treatments From the Patient Perspective

Econometrica released a new issue brief exploring treatment options for end-stage renal disease (ESRD) and their problems from the patient perspective. In partnership with LMI and the American Association of Kidney Patients, the ESRD Brief: Patient Perspectives discusses dialysis treatments and kidney transplantation and highlights the implications for patients of the ESRD Treatment Choices (ETC) Model. The ETC Model, rolled out by the Centers for Medicare & Medicaid Services, aims to encourage greater use of home dialysis and kidney transplants for Medicare beneficiaries with ESRD.

ESRD Patient Perspectives v4 5 pdf

ESRD Brief: Patient Perspectives

The Problem From the Patient Perspective